CWP Cage LIVE
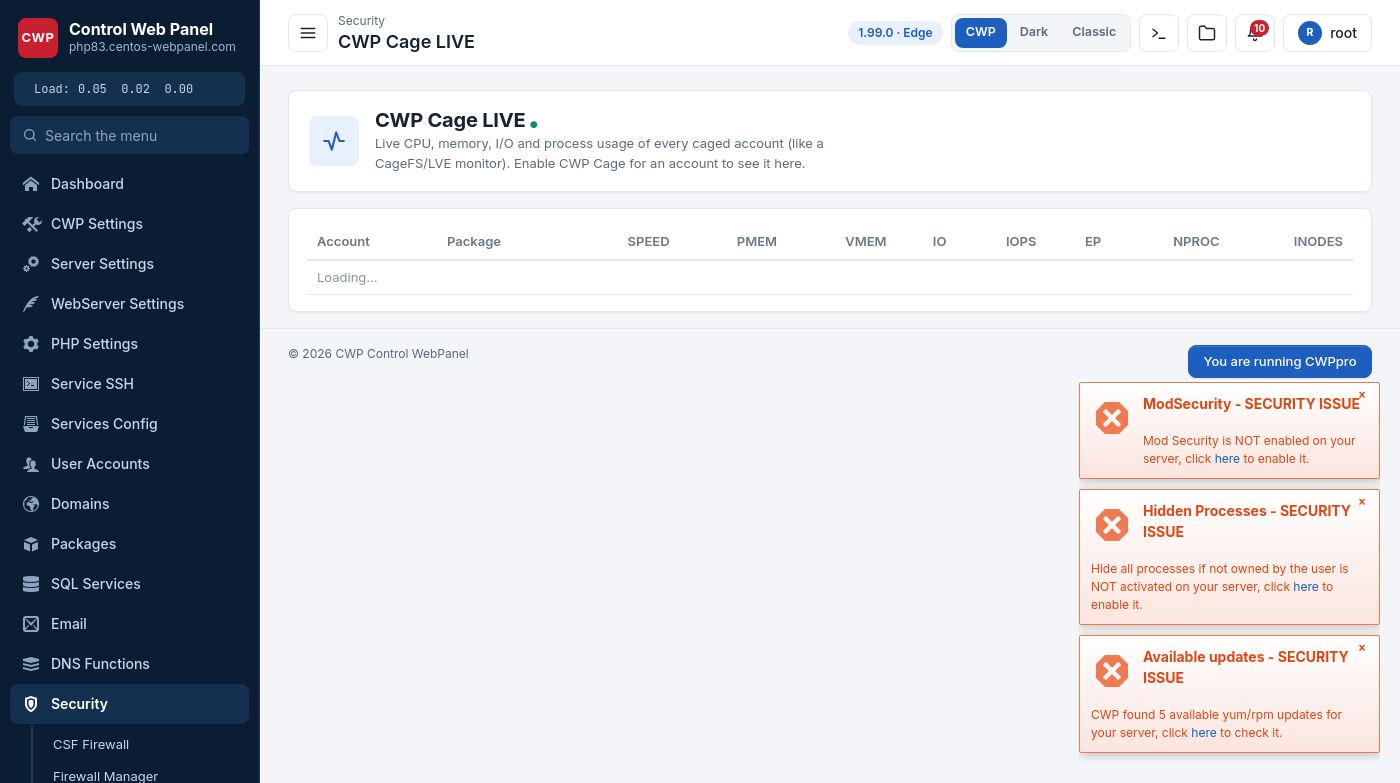
CWP Cage LIVE is the live resource monitor for caged accounts. It shows, in real time, how much each caged hosting account is using — CPU, memory, I/O and processes — the way a CageFS/LVE resource monitor does. An account only appears here once it has been caged in CWP Cage.
Where to find it
Security → CWP Cage LIVE in the admin panel (also reachable from the CWP Cage LIVE button on the CWP Cage page).
What it shows
A live table, one row per caged account, refreshing on its own:
| Column | Meaning |
|---|---|
| Account / Package | the hosting account and its package |
| SPEED | current CPU usage |
| PMEM | physical (resident) memory in use |
| VMEM | virtual memory in use |
| IO | disk I/O throughput |
| IOPS | disk operations per second |
| EP | entry processes (concurrent PHP requests) |
| NPROC | number of processes |
| INODES | inodes used |
If the table stays empty or shows “Loading…”, no accounts are caged yet — enable CWP Cage for an account first and it will appear here.
How to use it
- Watch a newly caged account under real traffic to confirm it has enough headroom.
- Spot the account that is driving CPU, memory or I/O on a busy server at a glance, instead of reading
topand mapping PIDs back to accounts by hand. - Use it together with Security → Cgroups Resource Limits when you want to cap what a heavy account can use.
Notes
- The figures are per caged account; an account that is not caged does not report here. Cage it in CWP Cage first.
- The monitor reads the cage’s own accounting, so the numbers reflect exactly what the isolated account is consuming, not the whole server.