Navigate to:
Graphs --> Netdata
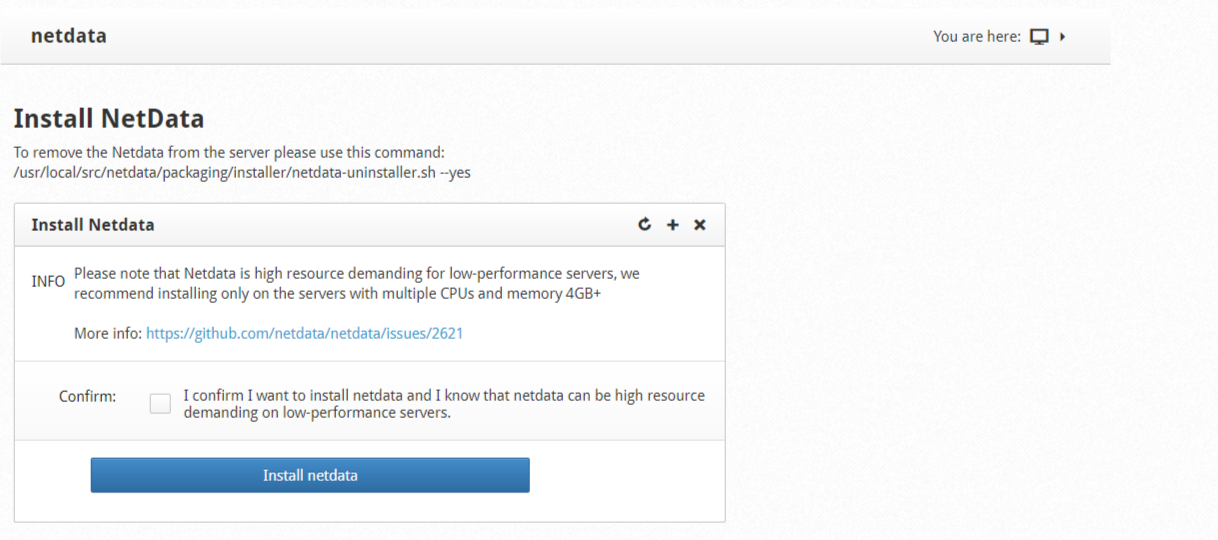
In order to view NetData graphics, you must first authorize its installation.
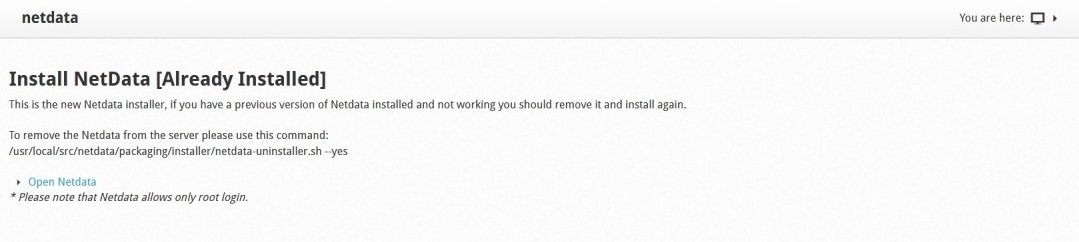
To view the graphics click on open NetData.
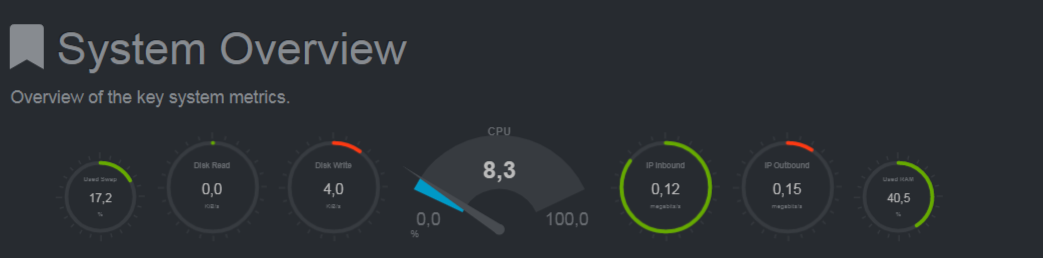
 Overview of the key system metrics.
CPU
Total CPU utilization (all cores). 100% here means there is no CPU idle time at all. You can get per core usage at the CPUs section and per application usage at the Applications Monitoring section.
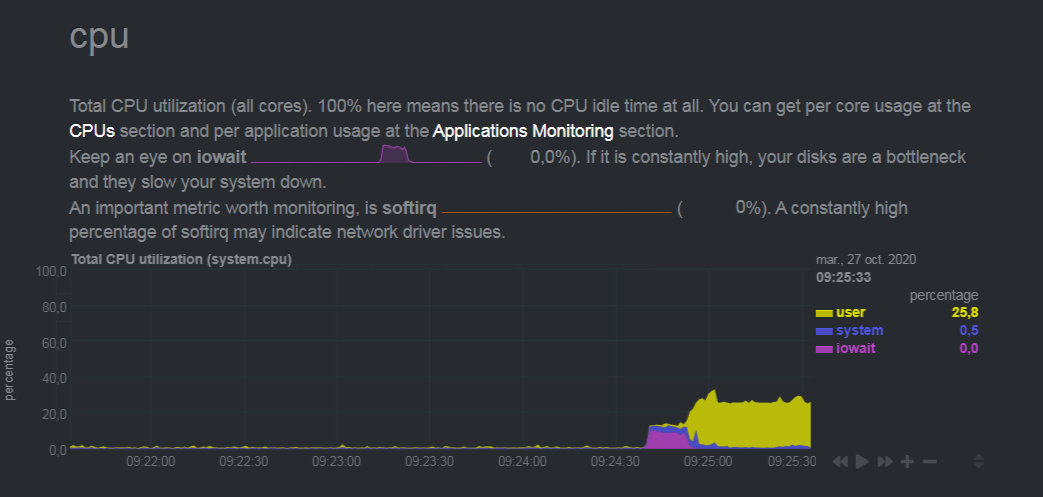
To view the graphics of Load, Disk, Ram, Swap, Processes, Idlejitter, Interrupts, Softnet, Entropy, Uptime, among others.